As a developer at Gear Tech, I’m constantly looking for ways to optimize the performance of our blockchain. The Gear protocol, which we’re building using Substrate, benefits greatly from these optimizations. In this blog post, I’ll take you through our process of profiling a WASM runtime in Substrate using the Linux perf tool. This post is intended for developers who already have experience with Substrate and are looking to explore their codebase further.
Our main goal in this profiling process is to explore the performance of the runtime interface and identify any weak spots. By understanding where our code spends most of its time, we can focus our optimization efforts where they will have the most impact.
Building Perf from Source
Perf is a powerful performance analysis tool for Linux 2.6+ based systems. It abstracts away CPU hardware differences and presents a simple command-line interface. As part of the Linux kernel source code, it requires compilation from source.
One of the reasons for building perf from source is to address the slow execution of the perf script command in the default version available in many Linux distributions. In our case, the wasmtime jitdump files are quite large, and running perf script on them using the default perf version can take hours. By building perf from source, we can apply patches to improve the execution speed of perf script. For more information about this issue and the patches applied, check out this article ~60x speed-up of Linux “perf”.
Best way is to match your kernel version with linux repo. Mine is 5.19 but there is a bug with detecting libcrypto.h more here. So I will use latest v6.4 realease which also works.
git clone https://github.com/torvalds/linux.git && cd linux/tools/perf
git checkout v6.4
sudo apt install make gcc flex bison libdwarf-dev libdw-dev binutils-dev libcap-dev libelf-dev libnuma-dev libperf-dev python2 python2-dev python-setuptools libssl-dev libunwind-dev libdwarf-dev libunwindw zlib1g-dev liblzma-dev libaio-dev

make
make install
Now we have our perf installed in /root/bin/
➜  perf git:(v6.4) ✗ /root/bin/perf --version
perf version 6.4.g6995e2de6891
Compiling a Substrate Node with Debug Symbols
To get the most out of our profiling, we’ll need to compile our Substrate node with debug symbols and runtime-banchmarks feature.
RUSTFLAGS="-Cdebuginfo=0" WASM_BUILD_RUSTFLAGS="-Cdebuginfo=0" cargo b -r -F runtime-benchmarksWe are passing -Cdebuginfo=0 to substrate-wasm-builder to enable debug symbols inside WASM runtime.
Collecting Profiling Data
Now that we have our tools ready, it’s time to run some tests or a benchmark suite. We’ll use the perf tool for this, and we’ll enable jitdump at wasmtime to get detailed information about the JIT compilation process.
Some Linux distributions offer a libc6-prof package that includes frame pointers. This can help resolve symbols and call stacks that involve libc calls.
On Ubuntu, you can install this with:
sudo apt-get install libc6-proflibc6-prof can be used with LD_LIBRARY_PATH=/lib/libc6-prof/x86_64-linux-gnu
It may also be useful to have access to kernel addresses during profiling. These can be exposed with:
sudo sh -c "echo 0 > /proc/sys/kernel/kptr_restrict"The max stack depth is 127 by default. This is often too few. It can be increased with:
sudo sh -c "echo 4000 > /proc/sys/kernel/perf_event_max_stack"After all set we can now run our benchmarks to collect data. I will benchmark one of our syscalls gr_send.
LD_LIBRARY_PATH=/lib/libc6-prof/x86_64-linux-gnu WASMTIME_PROFILING_STRATEGY="jitdump" perf record \
                --call-graph dwarf -k mono ./target/release/gear \
                benchmark pallet \
                --chain=dev --steps=50 --repeat=50 --pallet=pallet_gear \
                --extrinsic="gr_send" --execution=wasm \
                --wasm-execution=compiled --heap-pages=4096
The WASMTIME_PROFILING_STRATEGY environment variable controls the profiling strategy used by wasmtime. The available options are:
none: No profiling.jitdump: Enables the jitdump profiling strategy. Collect profiling info forjitdumpfile format, used with perf on Linux.v8: Enables the v8 profiling strategy, which provides information about the execution of the WASM bytecode.
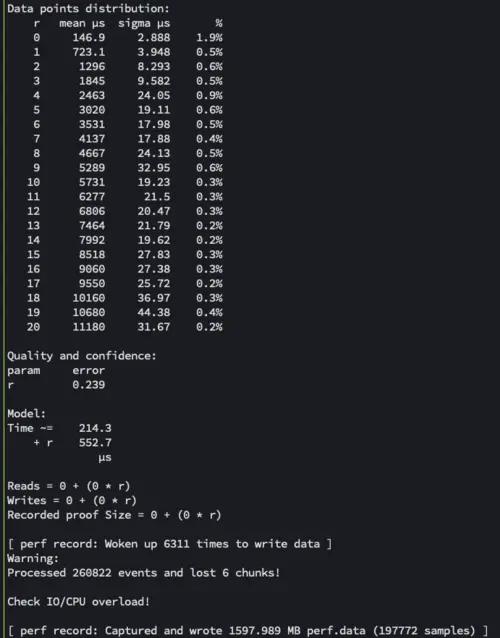
Output will look like this:
Converting Perf Data
Once we’ve collected our profiling data, we’ll need to inject the jitdump data into it.
perf inject --jit --input perf.data --output perf.jit.dataNext, we’ll convert our perf data into a format that we can analyze.
/root/bin/perf script -F +pid > /tmp/report.perfAnalyzing the Report
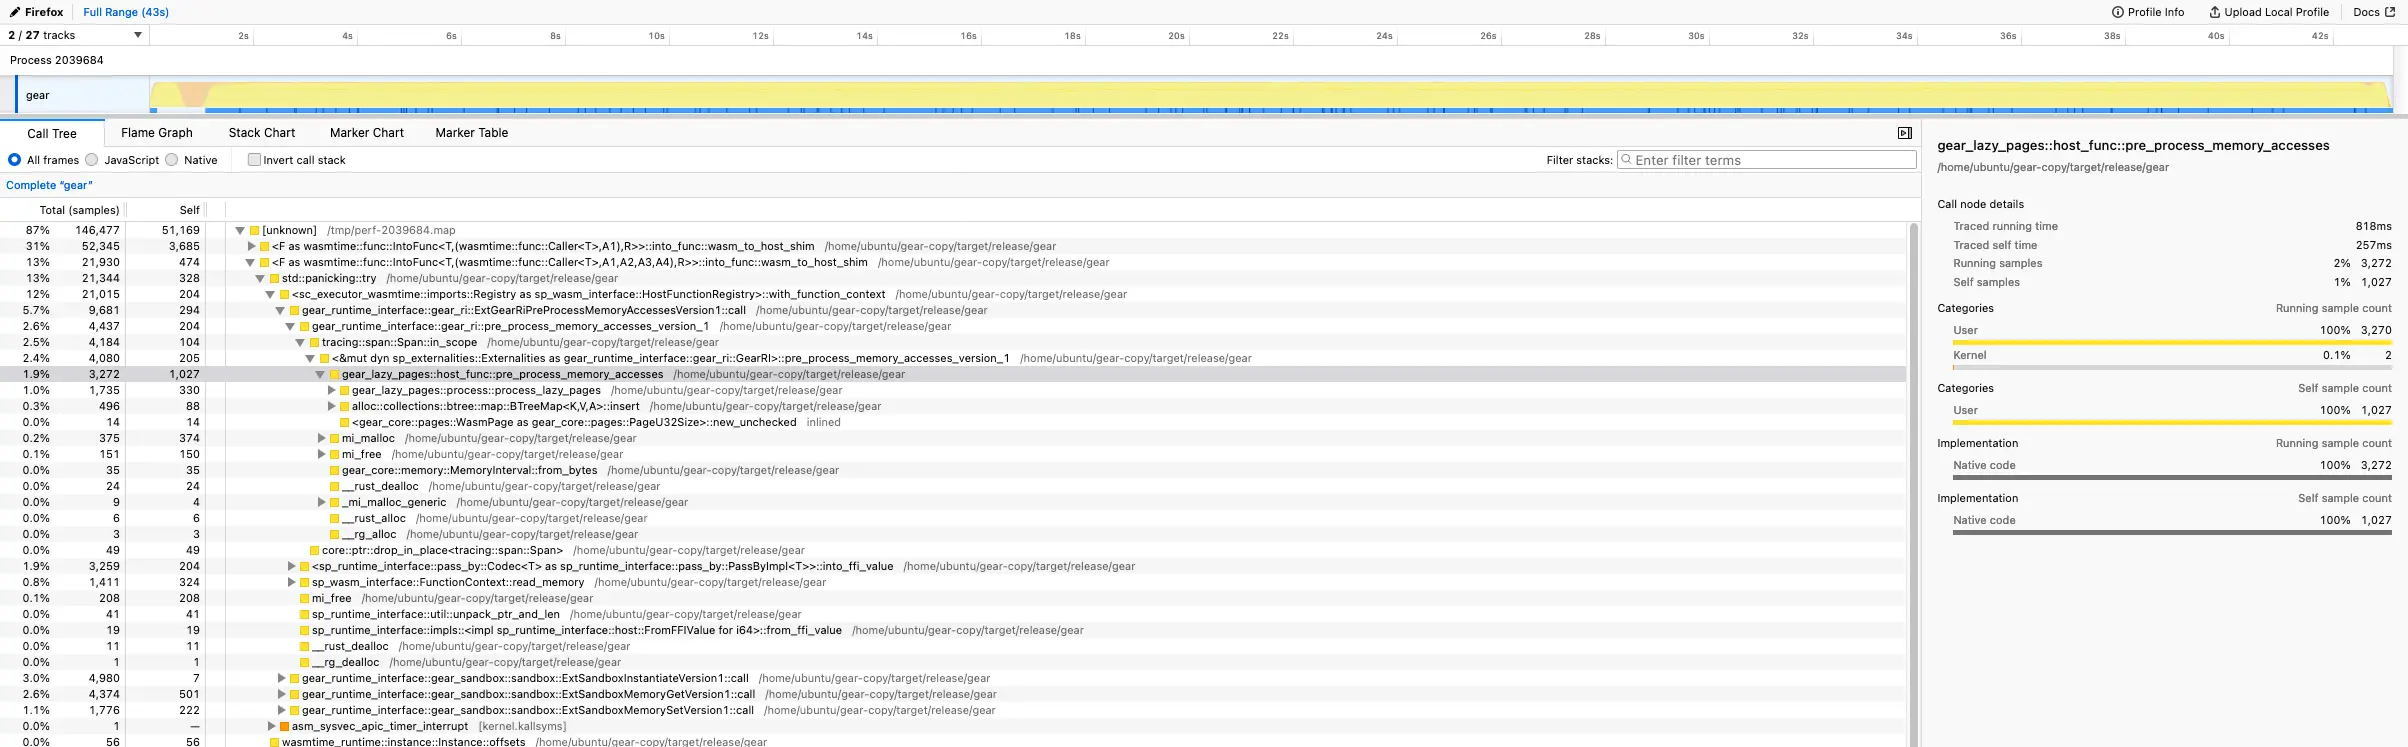
Finally, we can analyze our report. We’ll use the Firefox Profiler for this. Simply upload your report and start analyzing!
Conclusion
Profiling a WASM runtime in Substrate using perf is a powerful way to understand the performance characteristics of your blockchain. With this knowledge, you can optimize your code and make your blockchain faster and more efficient. This process has been a key part of our work at Gear Tech, and it’s led to significant performance improvements in the Gear protocol. You can learn more about our work on GitHub. Happy profiling!
In future posts, I’ll dive deeper into the specific “weak spots” we identified in the runtime interface and the results of our profiling and optimization process. Stay tuned for more insights into our work at Gear!
References
Gear. https://github.com/gear-tech/gear.
Substrate. https://github.com/paritytech/substrate
Mozilla. JIT Profiling with perf. https://firefox-source-docs.mozilla.org/performance/jit_profiling_with_perf.html.
Wasmtime. Profiling with Perf https://docs.wasmtime.dev/examples-profiling-perf.html